Hello! Nice to see you and thanks for stopping by. In the last two days I took a detour from programming but today I am going to pick up from where I left Google Maps APIs – Part V . Today’s post will be relatively shorter than previous ones because I am completing a section (at the end, I will give an app idea). Let us get to it. We should start with our previous finishing code:
(function () {
    window.onload = function () {
        var mapDiv = document.getElementById('map');

        var options = {
            zoom: 3,
            center: new google.maps.LatLng(37.09, -95.71),
            mapTypeId: google.maps.MapTypeId.ROADMAP
        };
        var map = new google.maps.Map(mapDiv, options);

        var cities = [];
        cities.push(new google.maps.LatLng(40.756, -73.986));
        cities.push(new google.maps.LatLng(37.775, -122.419));
        cities.push(new google.maps.LatLng(47.620, -122.347));

        var infowindow;
        for (var i = 0; i<cities.length; i++) {
            //create markers for each city
            var marker = new google.maps.Marker({
                position: cities[i],
                map: map,
                title: "City Number " + i
            });

            (function (i, marker) {
                //create even listeners (closures at work)
                google.maps.event.addListener(marker, 'click', function () {
                    if (!infowindow) {
                        infowindow = new google.maps.InfoWindow();
                    }
                    //set content
                    infowindow.setContent('City number ' + i);
                    //open the window
                    infowindow.open(map, marker);
                });
            })(i, marker);
        }
    };
})();
Automatically adjusting the viewport to fit all markers
Every time you are expecting dynamic data to be added to your map (markers), you want to make sure that none of them appears outside the map. The best way to handle this is by making a map that automatically adjusts to the markers added. In order to achieve that, we use LatLngBounds object.
LatLngBounds Object
A bounding box is simply a rectangle defining an area. Its corners consist of geographical coordinates and everything inside it is within its bounds. You can use it to calculate the viewport of a map and also determine if an object is in a certain area of the map.
The bounding box is of type google.maps.LatLngBounds object. It takes two optional arguments (southwest and northeast corners of the rectangle). Those arguments are of type google.maps.LatLng.
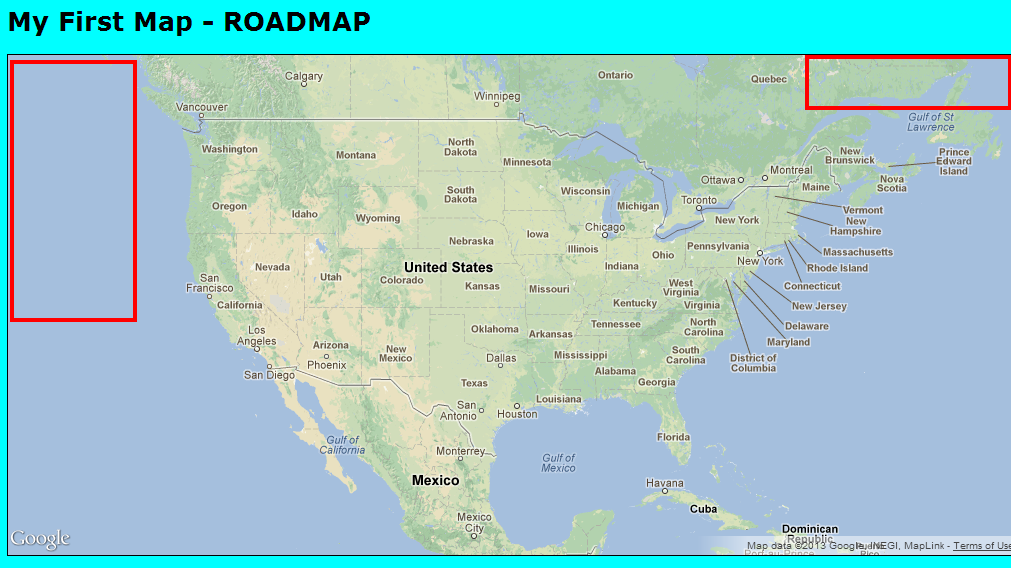
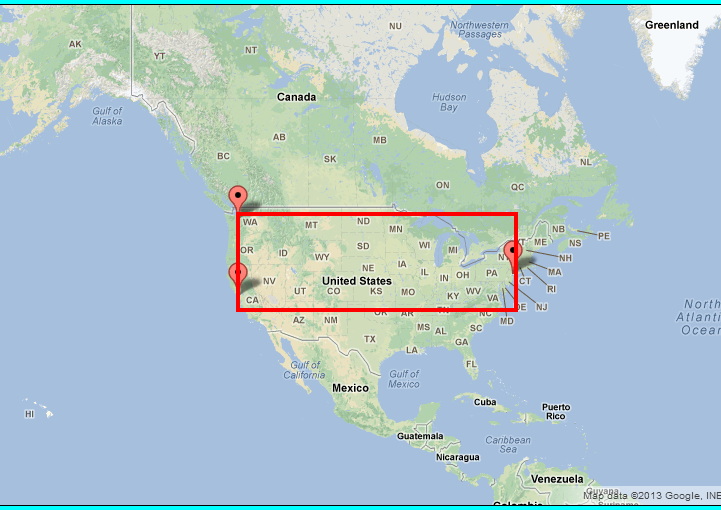
In order to manually create a LatLngBounds box, we have to determine the coordinates of its corners(you will see a better solution soon). Adding to our previous code, just below the line where we created our map, we could do this:
.
.
   var map = new google.maps.Map(mapDiv, options);
   var bounds = google.maps.LatLngBounds(
           new google.maps.LatLng(37.775, -122.419),
           new google.maps.LatLng(47.620, -73.986)
   );
.
.
.
Now our three markers will be within the above coordinates: Here is what am trying to allude to.
Using The APIs For The Heavy Work
In order to extend our example to automatically adjust the viewport to fit the markers, we have established that we need a LatLngBounds object. So, we first create an empty LatLngBounds object somewhere outside our for loop.
.
.
.
        var infowindow;
        //creating our bounds here
        var bounds = google.maps.LatLngBounds();

        for (var i = 0; i < cities.length; i++) {
            //create markers for each city
            var marker = new google.maps.Marker({
                position: cities[i],
                map: map,
                title: "City Number " + i
            });

.
.
.
After creating our empty bounds, we are going to extend it with each marker added to the map. We do this inside the loop like this:
.
.
.
      for (var i = 0; i < cities.length; i++) {
          [...]

          //extend the bounds here
          bounds.extend(cities[i]);
      }
.
.
.
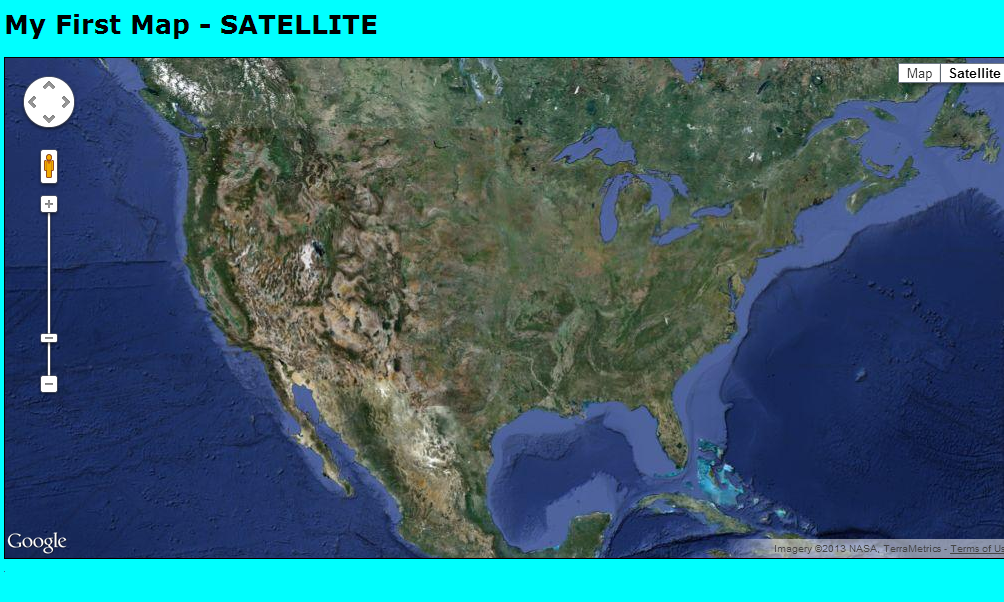
At last, after iterating through the markers, we are going to adjust our map using fitBounds() method of the map object.
[...]
    window.onload = function () {
        [...]
        var map = new google.maps.Map(mapDiv, options);

        [...]

   //Adjusting the map to the bounding box
   map.fitBounds(bounds);
}
That is it for the above case. We now have a map that fits all the markers perfectly inside the viewport. In fact, you can now add more cities and the map will automatically adjust the viewport. Oh wait, we can do this right now by adding my favorite city: Nairobi, Kenya and let us also represent Asia (seoul, South Korea – let there be peace in the peninsula).
[...]
        [...]
        [...]

        var cities = [];
        cities.push(new google.maps.LatLng(40.756, -73.986));
        cities.push(new google.maps.LatLng(37.775, -122.419));
        cities.push(new google.maps.LatLng(47.620, -122.347));
        cities.push(new google.maps.LatLng(1.2833, 36.8167));
        cities.push(new google.maps.LatLng(37.5833, 127.0000));

        [...]
  [...]

[...]
That should do it and now we can take a look at our awesome map with more markers.

There you have it! I hope you had some fun playing around with this example. Within a very short time and few lines of code, we have created a map that shows different cities displayed using markers. Now consider having users enter their cities as you watch the markers increase. I like this so much am starting to think of a cool app.
Let me show you the entire code then give you a cooler idea of an app!
(function () {
    window.onload = function () {
        var mapDiv = document.getElementById('map');

        var options = {
            zoom: 3,
            center: new google.maps.LatLng(37.09, -95.71),
            mapTypeId: google.maps.MapTypeId.ROADMAP
        };
        var map = new google.maps.Map(mapDiv, options);
        var bounds = new google.maps.LatLngBounds();

        var cities = [];
        cities.push(new google.maps.LatLng(40.756, -73.986));
        cities.push(new google.maps.LatLng(37.775, -122.419));
        cities.push(new google.maps.LatLng(47.620, -122.347));
        cities.push(new google.maps.LatLng(1.2833, 36.8167));
        cities.push(new google.maps.LatLng(37.5833, 127.0000));

        var infowindow;

        for (var i = 0; i < cities.length; i++) {
            //create markers for each city
            var marker = new google.maps.Marker({
                position: cities[i],
                map: map,
                title: "City Number " + i
            });

            (function (i, marker) {
                //create even listeners (closures at work)
                google.maps.event.addListener(marker, 'click', function () {
                    if (!infowindow) {
                        infowindow = new google.maps.InfoWindow();
                    }
                    //set content
                    infowindow.setContent('City number ' + i);
                    //open the window
                    infowindow.open(map, marker);
                });
            })(i, marker);
            //extend our bounds here
            bounds.extend(cities[i]);
        }
        map.fitBounds(bounds);
    };
})();
There you go. You can do whatever you want with it. Now here is an app idea (warning: it might sound silly).
Happy Places
The idea is simple. Use Twitter Search and Streaming APIs to track the use of a smiley face ):. It is not hard if you try. The fun part: using the user_ids of those who used the smiley face, fetch their locations (if they have set their location on their profiles) and check them against a local list of your own. If any of them match, put a marker on a map. It should be evident that more markers within a small city might indicate that residents there are friendly or happier but that is up for debate. Either way, it sounds fun. ):
See you soon. If you have questions, please ask. Take care and thanks for stopping by!